Variation in a group
What you will need: tape measure, ruler, laptop. If you do not have a tape measure you might need to make do with a ruler (or several rulers- be inventive!)
What you need to do:
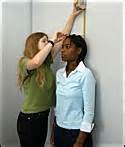
1. Measure the height of all individuals in the class. Each student should stand with their back against the wall. A ruler should be placed across the top of the head and the height measured with a tape measure on the wall behind.
What you need to do:
1. Measure the height of all individuals in the class. Each student should stand with their back against the wall. A ruler should be placed across the top of the head and the height measured with a tape measure on the wall behind.
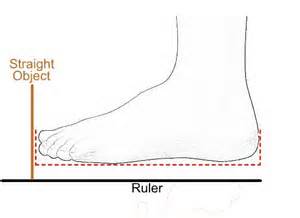
2. Measure the length of each student's right foot from the back of the heel to the tip of the longest toe.
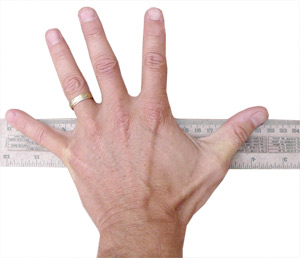
3. Us a ruler to measure the hand span of each student's right hand. This is measured from the tip of the little finger across the outstretched palm to the tip of the thumb.
4. Once you have collected all of your data you need to enter it into MS Excel and draw a histogram for each of the measurements. Hopefully, your teacher will have the skills to guide you through this process. Otherwise, you can do some research on the internet, or as a last resort will need to draw them by hand. To draw a histogram in MS Excel all you need to do is:
i) put the data for each set of measurements into a column i.e. one column for height, one for foot length, and one for hand span
ii) select the data for the measurement you are working with
iii) go to the insert tab at the top of the page
iv) near the centre top of the page there is an icon that looks like a simple blue histogram and is called "statistic chart". Click on the small black arrow to the right of this and select "histogram". The program will automatically select intervals and give you a neat chart.
5. Compile a brief report that should include:
- A brief introduction (a few sentences that explains why we are investigating variation HINT: we haven't discussed this yet so you may wish to Google the keywords "natural selection variation" to find some useful sources)
- Methods
- Results (including tables, graphs and a brief summary)
- Discussion, which should include:
- Describe the variation in the class for each characteristic you graphed
- State whether these variations are likely to affect the survival chances of people in the class. Explain your answer.
- Explain what you think causes the variations you have measured
- A brief conclusion
Your report should be typed in 12 point font and should contain all relevant tables and figures. Whatever you do not complete in class will be expected to be completed in your own time. 1-2 pages is sufficient (including tables and figures). Your report should be submitted to Managebac ASAP.
